Colouring Graphs
Katie Steckles
Back in May 2018, I wrote about a recent mathematical breakthrough in the field of colouring – known as chromaticity of the plane. The notion of colouring is part of many areas of mathematics and has surprising and useful applications.
As I mentioned previously, one of the most famous results in colouring problems is the Four Colour Theorem. There’s an important rule to state up front – if something is being mathematically ‘coloured’, we require that any two regions which touch (are connected by sharing an edge) are coloured different colours. It’s also often a challenge to try and find minimal ways to colour things in – using as few colours as possible. If you’d like to have a go at colouring (and don’t have any crayons to hand), I’ve built an online gadget with a selection of diagrams to colour, each of which can either be coloured using three colours, or require a minimum of four. See if you can figure out which is which!
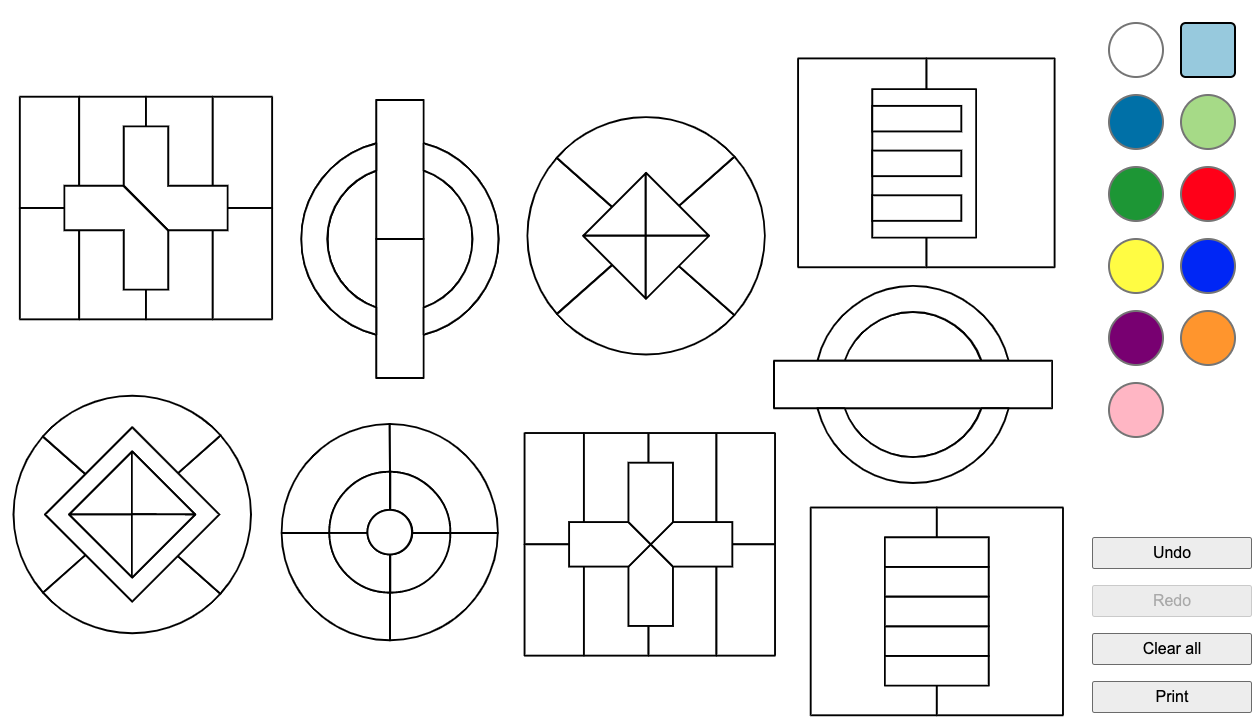
The Four Colour Theorem states that for any diagram you can draw on a piece of paper, the maximum number of colours you’ll ever need to colour it in, using the no-adjacent-regions-the-same-colour condition, is four. This means that on a flat surface like a piece of paper, it’s not possible to draw a diagram which needs more than four colours. (For clarity, you can use more than four colours to colour something in, but the result requires that four is the most you might be required to use – diagrams exist which can’t be done in fewer than four, but no diagram exists that needs five).
I find this a fascinating result – it’s not so much a mathematical theorem as it is a fact about the universe. The idea that something so wide-reaching, which applies to literally any picture I could draw, no matter how complex, has the answer ‘four’, is mind-blowing.
You might also notice I’ve been very careful in my choice of words here – ‘on a flat surface like a piece of paper’ is an important condition for the Four Colour Theorem to hold. For example, if you instead draw your diagram on the surface of a more complicated shape, such as a torus (donut) shape with a hole through the middle, it’s possible to construct diagrams requiring a minimum of 7 colours. This means it’s possible to take a blank white mug and a marker pen, and using the handle of the mug as a ‘hole’, divide it into 7 regions each of which touches all the others, and so would have to all be different colours if coloured in.
The minimum number of colours needed varies depending on the shape. A Möbius band, which involves making a twist in a strip of paper, can be split up in such that six colours are needed to colour it. The original four-colour statement applies only to drawings on a flat plane, or on topologically simple objects without holes, like the sphere. Any drawing on a sphere can have a hole punched in it at a single point, and then the hole can be stretched out to form the boundary of a flat sheet – whichever colour the region with the hole in was will then go around the whole outside edge, and the rest of the diagram will remain the same, so for colouring purposes such drawings are equivalent to ones on flat surfaces, and only need at most 4 colours.
Simplify, simplify
The theorem was proved in the 1970s (Four Colours Suffice, by Robin Wilson, is an excellent book outlining the proof), and the mathematics underlying the proof used graph theory. Graph theory is the study of collections of points joined in a network, with lines between some (but not necessarily all) of the pairs of points. In terms of colouring, the shape and size of the regions you’re colouring are unimportant, and the only crucial fact is the way the pieces connect together. This is captured by the structure of the graph – each point represents one region which needs colouring, and the lines capture the way they connect.

If you want to convert a drawing into a graph, you simply need to place a point somewhere in each region of the drawing, and then join with a line any two points representing regions that share an edge in the original drawing. This simplifies the shape into a structure made only of points and lines – but for the purposes of colouring, it’s the same thing.
Colouring a graph is as simple as assigning a colour to each point so that any pair of points which are connected use different colours. I’ve used my online gadget to give you some graphs to play around with colouring as well – how many colours do you need for each of the shapes? (Where lines cross, it’s just the pair at each end of the line that needs to be different colours – you can imagine the lines just pass over or under each other).
Colourability (or otherwise) of a graph is often a useful property of the graph to know, and it’s been well studied. For example, if a graph can be coloured with three colours, it’s called three-colourable, and the minimum number of colours needed to colour a graph is called its chromatic number. Whether a graph can be coloured using k colours or not is a property that doesn’t change even if you move the points around, as long as it stays connected in the same way – so it can be used to tell apart different graphs.
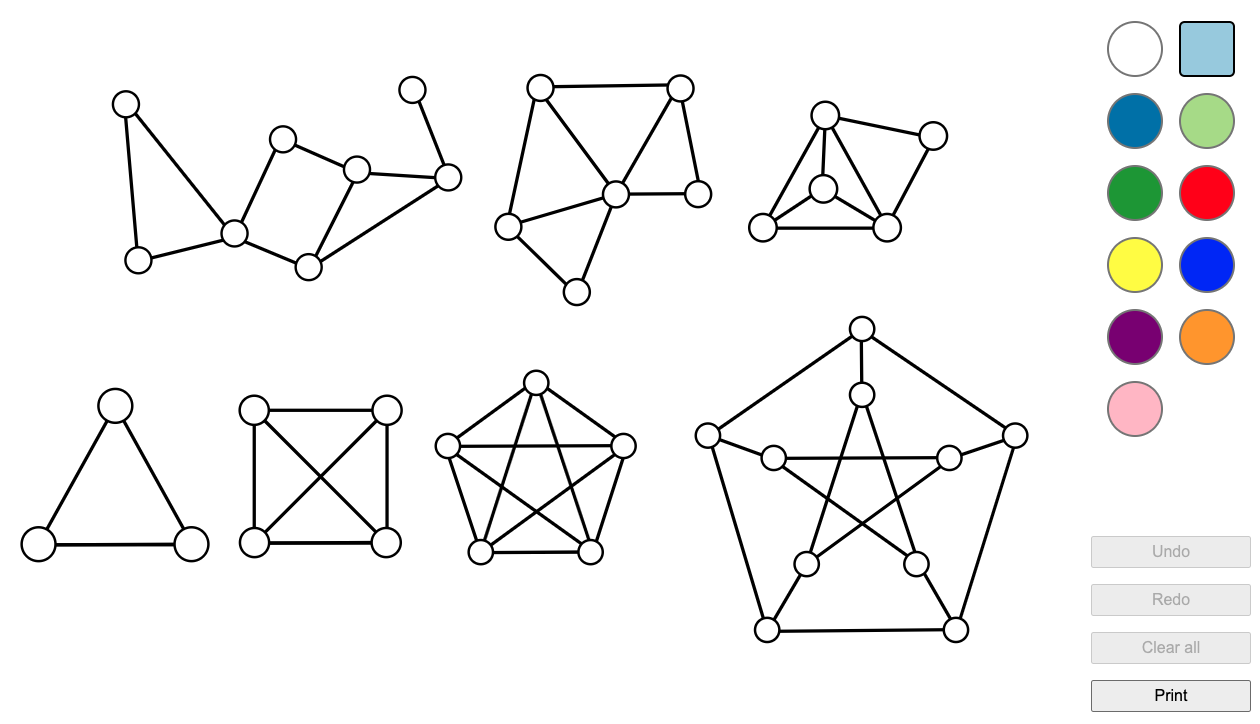
In the examples above, the graphs on the top row are all called planar graphs – this means they can be drawn on a flat piece of paper without any lines crossing. Such graphs can all be four-coloured (as per the Four Colour Theorem), although some can be done in fewer than four. The right-hand graph on the top row contains an example of a clique – this is a set of points for which every pair has a line between them, and in this case it’s the bottom left section of four points, arranged in a triangle with one in the centre. If a graph contains a clique of k points, it needs at least k colours.
The bottom row starts with three graphs which seem to follow a pattern – they’re called complete graphs and are made with n points each all connected to all n-1 other points. The complete graph on n points needs n colours to colour it in – and since the third graph there has 5 points all joined (it’s the complete graph on 5 points, called K₅) it’ll need at least 5 colours to colour it in. If you were wondering, this doesn’t contradict the Four Colour Theorem, as it’s not a planar graph – the lines can’t be untangled so they don’t cross.
The bottom right graph is called the Petersen graph – it’s a commonly used example within graph theory since it has many interesting properties, and even though it looks similarly complicated to the complete graph on 5 points, it can be 3-coloured.
There’s also a lot of interesting maths around finding efficient algorithms to colour graphs – the chromatic polynomial encodes the number of different ways to colour a given graph, and algorithms exist to compute the chromatic number (minimum number of colours needed), and the chromatic polynomial of a graph. Such calculations can become very computationally intensive for larger graphs.
But what’s the point(s and lines)?
This might seem like all so much colouring in – but as we often see in pure maths, something which seems trivial can have interesting applications. For example, you can use graph colourability in scheduling and logistics. If you have a series of sessions to schedule as part of an event, some of which will take place at the same time as each other, you can construct a graph in which each point represents a session and lines between points are drawn if those two sessions will happen at the same time.
Then, if you colour the graph, any two sessions joined by a line will be different colours, and the number of colours needed overall will tell you how many rooms you’ll need to schedule all the sessions. Each colour corresponds to one room, and sessions taking place at the same time will always be in different rooms. The number of colours needed will depend on the complexity of the graph – but you could say for certain, if (e.g.) your graph contains a clique of four sessions all pairwise coincidental, that you’ll definitely need at least four rooms.
The same techniques can be used in allocating processing resources or wireless channels in computing, scheduling sports matches or taxis, or designing seating plans. Colouring is also often used as a technique in problem-solving and crops up in many mathematical puzzles – including sudoku, which can be solved using graph colouring. This Numberphile video features mathematician Erica Klarreich talking about graph colouring and some nice applications.
The post Colouring Graphs originally appeared on the HLFF SciLogs blog.